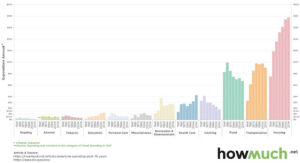
There are numerous studies on how Americans spend their income as a percentage of their pay. A common claim is that households spend approximately 75% of their income in only 4 areas: Housing, Transportation, Food, and Clothing. The following chart which shows spending by category over the 73-year period of 1941-2014 does show how these categories, especially the first three, are far greater than the others. In more recent years, healthcare and entertainment spending has exceeded clothing.

Our son just completed his first year of college. He is attending a university approximately 2.5 hours away from our home where he lived in the dorm and ate in the dining hall (a requirement for freshmen). There were 3 or 4 meal options to choose from during the enrollment process. All were similarly priced but varied in terms of dining hall meals allowed versus “flex dollars” that could be used at campus restaurants. We opted for the unlimited plan, which allowed for the most dining hall meals and least flex dollars. If he ate 3 meals per day, his per meal rate would be around $8.00. That’s $720 per month! In comparison, we typically budget $830 per month for food for our family of 3. Hopefully, we can lower the cost next semester when he returns to campus in a shared apartment with kitchen facilities.